Progression in primary computing
25 February 2020

Almost a year ago, we began the daunting task of deciding what the ‘best’ approach would be to covering the entire content of the Key Stage 1 and 2 Computing National Curriculum. There would be 36 units of work (1 per half term, for every year group) to create a comprehensive scheme of work for the NCCE Resource Repository. We had the national curriculum, with its broad statements for the end of each Key Stage, but what the curriculum doesn’t show is how to get learners from their starting point, to those predefined end points. We started with lists of objectives that we had used previously, and thought were useful, and tried to cover everything and make them progressive — this turned into a very colourful document, which actually hurt your eyes to look at! This was not the way forward. It was really hard to see how one learning objective was related to others and with different year groups on different pages there was no way to see between year groups. Then a colleague shared their knowledge of some research they’d read about learning trajectories in other subjects such as maths, and we began to try something similar.
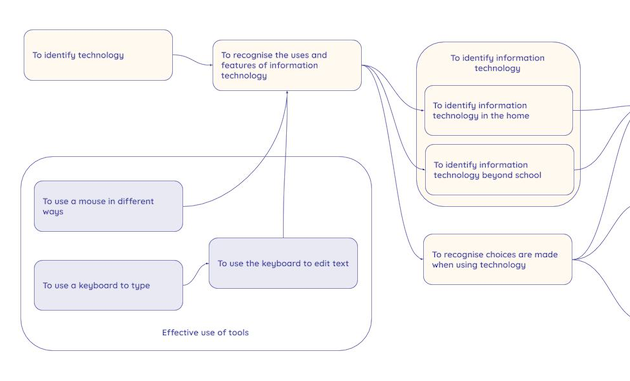
The first change we noticed when trying to consider progression with a learning graph, was a change in conversations from the ‘content’ of the lessons to the ‘learning’. We didn’t start with the aim of producing six ideas (one per lesson), instead we concentrated on the key concepts and skills that children needed to master to meet the national curriculum requirement. We also didn’t start by defining the ‘topic’ of the unit e.g. ‘In Year 2, we will cover making digital posters’ we instead asked ourselves, what do children need to know when they start Year 1? What about the skill ‘To use a mouse in different ways‘ ? At this stage it does not matter how we teach that, but that this is a key skill. Often we also want to add a related concept, e.g. ‘To recognise the uses and features of information technology’.
Subsequently, when we were discussing how we usually taught a particular concept or skills, it was followed up with the question ‘why?’. Why was that the best way to teach it? Often there was a reason behind it, but laying out the concept and the skills first allowed us to challenge those ideas around what we had ‘always done’ and ensure we had a clear rationale behind our approach.
How we make them
Creating learning graphs is not easy. Ensuring that the concepts and skills are the right stepping stones to a larger learning milestone and that those concepts which are dependencies are linked is a collaborative process and it takes a lot of time, thought, and brain power! However, here is a brief overview of the process:
- Look at which National Curriculum statements you need to cover in this unit
In the beginning, we roughly grouped which parts of the national curriculum would be covered in which strands of our spiral curriculum. - Consider the milestone concepts and skills within that Key Stage
These are your really clear milestones that suggest one before the other, for example, before we can understand how the internet works, we need to understand how a local network works. These are placed in a rough sequence. - Fill in the smaller steps between the milestones
This is a very iterative process as we begin to discuss which conceptual leaps are too far and what must fit in between to make that next step achievable. At this stage we get as much input from groups of teachers as we can — the more discussion we have about why certain skills and concepts are put in a specific order, the better! At this point, we’re not yet thinking about year groups or lessons. - Developing learning objectives and success criteria
After the progression has been agreed, we start breaking the sequences into year groups. At this point, we may still have 12 or more skills and concepts to be covered in one unit of work. Some milestone concepts are the key to a unit and are the overarching statement that form the learning objectives. Others are smaller steps that help the learners’ understanding develop, and these are the success criteria. While these inform our learning objectives and success criteria, the wording may not match exactly as the learning graphs are designed for teachers, whereas the learning objectives and success criteria are age-appropriate so that they can be understood by the learners. - Developing lesson ideas
It is now that we start to consider the context of the learning. We start from a position of what tool or context will help learners to achieve a specific lesson objective rather than the other way around.
This is a long process which all takes place before we even start writing content, but the early results of our pilot schools (if you would like to pilot our content, please sign up here) is overwhelmingly positive. We are regularly being told that the content is accessible to all learners and that they are able to achieve the objectives we have set. So far, the hard work is paying off!
Are they still useful after the units have been written?
The learning graphs allow teachers to sequence the concepts and skills that they're introducing in their lessons when teaching our units. This allows for progression within units as well as across the units. They show which skills and concepts are reliant on prior knowledge and where (conceptually) to go next if learners have mastered one.
Historically, when we see ‘progression’ documents or frameworks they consist of core 'levels' or stages either developmentally or by Key Stage. These documents have their place, but they do not support teachers in suggesting how to get their learners from one stage to another, nor do they support the building of core concepts through a predefined trajectory. This is what our learning graphs do.
Not all learners progress in the same way; some have gaps in their knowledge, or for whatever reason, have missed out on some of the content covered in early year groups. Others excel, and want to move forward ahead of the rest of the class. The learning graphs can support teachers to meet the needs of these learners. If a learner is struggling with a concept, they may need to consolidate the previous concept/skill in order to progress. Following the learning graphs shows you what gap needs to be filled or what the next challenge is.
These learning graphs are our first iteration, and we have gotten better at producing them over time. They may not be 100% correct right now, as they are based on our own experiences and we learn more every day. If you have any feedback, it is always welcome (resourcesfeedback@raspberrypi.org). As well as this, all the learning graphs are shared with an Open Government Licence (OGL) which means anyone can edit them and change them to suit their setting.
What do we do next?
After we have developed the first iteration of all of the computing content (July 2020), we intend to go back and review our processes, including the work we have done around learning graphs. Here are some early thoughts we have had around next steps:
- Create higher-level learning graphs (which may be named something different) to show the clear progression between units as well as within them
- Investigate research into similar approaches, to see how learning graphs can be put to other uses, such as informing assessment and pedagogy
- Conduct research into how learning graphs are being used by teachers and how they can be refined and improved to better suit their needs
The units of work that we write are being uploaded each week. Check out teachcomputing.org/resources to see the latest units. Within each unit are all the resources you need (lessons plans, slides, and activity resources) to teach the lesson, as well as the learning graph for you to see how we have mapped progression within the unit.
Further reading
- https://blog.teachcomputing.org/how-to-use-learning-objectives-graphs-to-plan-progression/
- Check out our live resources https://teachcomputing.org/resources or sign up to pilot our future units here http://ncce.io/resourcespilot
- Binkowski, T.A., Franklin, D., Rich, K.M., Strickland, C. (2018) Decomposition: A K-8 Computational Thinking Learning Trajectory. In: Proceedings of the 2018 ACM Conference on International Computing Education Research (ICER ’18), pp. 124–132.
Call to action
Take a look at some of the learning graphs already live on the Teach Computing website alongside some of your own planning. Consider what similarities and differences are there in how we build concepts and skills and how you do? Neither way is right or wrong, but it is a useful conversation to consider if you have structured your learning in that way.
About the author

Sway Grantham, Senior Learning Manager (Primary), Raspberry Pi Foundation.