How to use Learning Objective Graphs to plan progression
09 July 2019

When teachers plan a sequence of lessons, their natural first step is to produce a list of learning objectives. These objectives then need to be arranged in a reasonable order and grouped into a progression of lessons.
This task can prove daunting: most strands in the Computing curriculum span several year groups (e.g. algorithms, programming, computing systems, networks, representations), resulting in long and broad lists of objectives that are difficult to organise into coherent progressions.
To tackle the size and complexity of these planning tasks, we at the NCCE structure lists of learning objectives into Learning Objective Graphs. Let me walk you through our process.
As a tool for this, you can use any drawing application that supports connectors.
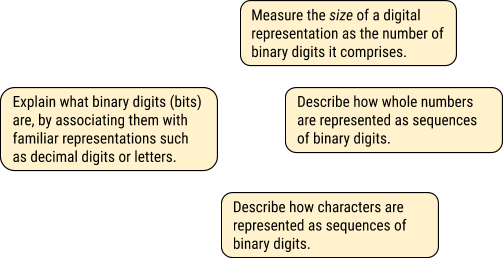
Step 1: turn the learning objectives into nodes
Given a list of learning objectives, you start by creating a node for each one of them: a rectangle containing the objective (or a short summary of it). This will result in an initially unstructured collection of nodes. As there will eventually be a flow to the objectives in the graph, it makes sense to order the nodes from left to right: those with foundational objectives to the left, and those with more advanced objectives to the right.
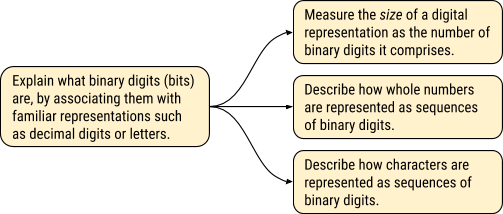
Step 2: draw connections between the nodes
The next step is to capture the relationships between learning objectives by drawing connections between them: if achieving objective A is a direct prerequisite for achieving objective B, then a solid arrow should point from A to B. The arrows you draw are the graph edges, and they capture the dependencies between objectives as well as potential teaching pathways. Keep in mind that at this stage, you are not yet committed to a particular traversal through the graph.
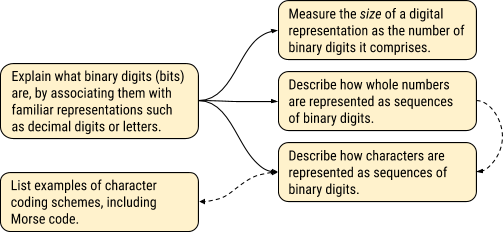
In many cases, the existence and direction of an arrow between two objectives is obvious. However, it may be that a learner could progress between two related objectives in both directions, and you can illustrate this using a bidirectional arrow. It may also be that the connection between two objectives is soft: one objective is not required for the other, but achieving the former scaffolds and supports achieving the latter. You can illustrate this type of looser relationship between objectives using dashed arrows.
Experiment with your model to improve it
Bear in mind that, when you place the arrows, many decisions you make will be subjective. For the initial placement, you will rely on pedagogical content knowledge, research, experience, and intuition, and you may make mistakes and false assumptions. Multiple iterations of experimenting with these pathways in practice will inform your model and allow you to improve it.
Lesson planning with a Learning Objective Graph
Considerable rearranging and decluttering will always be necessary, but the resulting graph illuminates the structure of your learning objectives better than any list could, and it facilitates your decision-making in the subsequent stage of planning your lessons.
The process of constructing a Learning Objective Graph helps you to uncover overlapping objectives and, most importantly, identify possible gaps that need to be filled with intermediate nodes to smooth the transition between objectives.
Related reading
There’s relevant work on learning trajectories in Mathematics [1], and the concept has recently also been explored in the context of computational thinking [2, 3].
References
- Douglas H. Clements and J Sarama. 2004. Learning Trajectories in Mathematics Education.
- Kathryn M. Rich, Carla Strickland, T. Andrew Binkowski, Cheryl Moran, and Diana Franklin. 2017. K-8 Learning Trajectories Derived from Research Literature: Sequence, Repetition, Conditionals.
- Kathryn M. Rich, T. Andrew Binkowski, Carla Strickland, and Diana Franklin. 2018. Decomposition: A K-8 Computational Thinking Learning Trajectory
About the author
George Boukeas is a Learning Manager (Secondary) at Raspberry Pi Foundation.